
 Business License

Software-Defined Instruments: How USB Spectrum Analyzers Are Changing the RF Testing Industry
1. The Benchtop Instrument That Would Not Fit in a Carry-On
An RF field engineer arrived at a remote cell site in a mountainous region after a six-hour journey that included a commercial flight, a two-hour drive, and a 45-minute hike. His task was to identify the source of intermittent interference that was degrading LTE uplink performance at the site. The benchtop spectrum analyzer he had requested weighed roughly 14 kilograms in its transit case and barely fit in the cargo hold of the small regional aircraft. After unpacking and powering up, he discovered the instrument's calibration had drifted during transport and the self-alignment routine took an additional 20 minutes. He completed the measurement, found the interference source, and spent the return trip wondering why RF test equipment had to be this cumbersome when his phone, laptop, and tablet all ran on software-defined architectures that fit in his backpack.
That engineer's frustration reflects a broader shift happening across the RF test and measurement industry. The transition from hardware-defined benchtop instruments to software-defined USB-based instruments is not just about size and weight. It represents a fundamental change in how RF measurements are acquired, processed, displayed, and automated. This article examines how USB spectrum analyzers work, why their performance now rivals traditional benchtop units, and what the software-defined approach means for engineering workflows, budgets, and the future of RF testing.
2. What "Software-Defined" Actually Means for an Instrument
A traditional spectrum analyzer implements its signal processing chain in hardware. The RBW filters are physical crystal or SAW filters. The detector is an analog diode circuit. The video filter is an RC low-pass. The display processing runs on a dedicated DSP chip inside the instrument with a fixed feature set determined at the factory. Adding a new measurement capability means designing new hardware.
A software-defined instrument moves the processing boundary as close to the antenna as practical. The RF front end downconverts and digitizes the signal. Everything after the ADC, including filtering, FFT computation, detection, demodulation, and display rendering, runs as software on a general-purpose processor in the host computer. Adding a new measurement capability means writing new software, which can be deployed as a firmware update or a new application module.
USB spectrum analyzers take this architecture to its logical conclusion by removing the embedded computer entirely. The instrument is a calibrated RF front end with an ADC and a USB interface. The host computer, which the engineer already owns and upgrades independently of the instrument, provides all processing, storage, display, and connectivity. This separation of the RF hardware from the compute platform means that instrument performance improves over time as computers get faster, without requiring a new instrument purchase.


3. The USB Form Factor: More Than Just Smaller
The obvious advantage of a USB spectrum analyzer is portability. An instrument the size of a paperback book, weighing under a kilogram and powered entirely from the USB port, changes where RF measurements can happen. Field engineers carry it to cell towers and broadcast sites. University students take it between lab benches and dorm rooms. Production technicians move it between test stations without scheduling shared equipment.
The less obvious advantage is thermal management. A benchtop instrument must dissipate roughly 50 to 150 watts of heat from its processor, display, and power supply, all inside an enclosed chassis. The RF front end sits next to this heat source, and temperature variations cause gain drift, LO frequency shift, and increased phase noise. A USB instrument dissipates roughly 5 to 15 watts, mostly from the RF front end itself, and spreads that small thermal load across a larger surface area relative to its volume. The result is faster warm-up to stable operating conditions and lower phase noise for a given circuit topology.
USB instruments also eliminate the fan. Benchtop analyzers use fans for cooling, and fan vibration couples into the LO and IF circuits as microphonic phase noise. This shows up as low-frequency sidebands around displayed signals, typically at 20 Hz to 200 Hz offsets, that are not present in fanless USB instruments. For close-in phase noise measurements below 1 kHz offset, this difference can be measurable and significant.
4. Performance Parity: Closing the Gap
The historical objection to USB spectrum analyzers was performance. Early USB instruments had limited frequency range, poor dynamic range, and slow data transfer that made real-time analysis impossible. That gap has largely closed. The table below compares typical specifications of modern USB and benchtop instruments in the same price tier.
| Specification | Modern USB Analyzer | Equivalent Benchtop |
|---|---|---|
| Frequency range | 9 kHz to 20 GHz or 43.5 GHz | 9 kHz to 20 GHz or 43.5 GHz |
| Real-time bandwidth | 10 MHz to 160 MHz | 10 MHz to 500 MHz |
| DANL at 1 GHz | -155 to -160 dBm/Hz | -160 to -165 dBm/Hz |
| Phase noise at 10 kHz offset | -95 to -108 dBc/Hz | -105 to -120 dBc/Hz |
| POI (100% probability) | Down to roughly 5 microseconds | Down to roughly 1 microsecond |
| Weight | Under 1 kg | 5 to 15 kg |
| Power consumption | 5 to 15 W (bus-powered) | 50 to 200 W |
The remaining performance delta is concentrated in phase noise and absolute amplitude accuracy. Benchtop instruments still achieve roughly 10 to 15 dB better phase noise through higher-performance LO synthesizers and more elaborate temperature compensation. For applications that demand the lowest possible phase noise, the benchtop instrument retains its advantage. For the roughly 80% to 90% of RF measurements that fall within the capability envelope of a modern USB analyzer, the USB instrument delivers equivalent results in a smaller, lighter, and less expensive package.
5. The API Advantage: Automation Without Middleware
USB spectrum analyzers are native software peripherals. They communicate through a documented API over USB, typically SCPI commands or a vendor-specific SDK that wraps SCPI into Python, C, or MATLAB function calls. A few lines of Python code can configure the instrument, acquire data, perform custom analysis, and log results to a database, all running on the same computer that displays the measurement.
A benchtop analyzer with a LAN or GPIB interface can be automated too, but the setup involves network configuration, VISA libraries, and often a separate control PC. The USB analyzer collapses this stack into a single USB cable and a software library. For production test systems, this simplification reduces integration time from days to hours and eliminates an entire class of network-related failures that plague LAN-connected instruments in factory environments.
The API model also enables measurement techniques that are impractical on a benchtop instrument with a fixed measurement menu. A custom digital demodulation algorithm, a specialized burst detection routine, or a machine-learning classifier for signal identification can all be implemented in Python on the host computer, processing the raw IQ data streamed from the USB analyzer. The instrument becomes a calibrated data source, and the analysis becomes limited only by the engineer's programming skill rather than the instrument's firmware feature set.
6. The Economics of Software-Defined Instruments
The cost structure of a USB spectrum analyzer differs fundamentally from a benchtop instrument. The benchtop includes an embedded computer, a display panel, a power supply, a chassis, front-panel controls, and the mechanical engineering to package all of this into a rugged enclosure. These components represent roughly 40% to 60% of the bill of materials. The USB analyzer eliminates all of them, putting the component budget entirely into the RF front end and ADC. The result is that a USB analyzer costing roughly half as much as a benchtop analyzer often uses the same or similar RF components.
The upgrade cycle also favors USB instruments. A benchtop analyzer's embedded computer ages at the same rate as its RF front end, and after five to seven years the processor may not run the latest firmware or support modern connectivity standards. The USB analyzer's host computer can be upgraded independently, and the instrument continues to benefit from faster processing as the user replaces their laptop on a normal two-to-three-year cycle.
Some time ago, a research institute in Russia was outfitting a new RF laboratory with a limited equipment budget. They needed spectrum analysis capability from 9 kHz to 20 GHz across four workstations. Dongguan Chenyi Electronics proposed a mix of USB real-time spectrum analyzers for three of the workstations and one high-performance benchtop unit for the phase noise measurement station. The total cost was roughly 40% less than equipping all four stations with benchtop analyzers, and the USB units provided real-time bandwidth that the equivalently priced benchtop units would not have offered. The institute's researchers report that the USB analyzers handle roughly 85% of their daily measurements, and the benchtop unit is reserved for the 15% that require its lower phase noise and higher dynamic range.


7. Field Deployment: Instruments That Go Where the Work Is
The combination of USB power, small size, and software-defined architecture makes USB spectrum analyzers natural tools for remote and distributed monitoring applications. A USB analyzer connected to a single-board computer like a Raspberry Pi or an Intel NUC can operate as a remote spectrum monitoring node, streaming FFT data back to a central server over Ethernet or cellular connection. The entire node, including the analyzer, computer, weatherproof enclosure, and antenna, costs roughly one-fifth to one-tenth as much as a traditional remote monitoring receiver.
This cost reduction changes the economics of spectrum monitoring. Rather than deploying one expensive monitoring receiver at a single location and hoping it captures the interference event, an organization can deploy five or ten USB-based nodes across a geographic area and triangulate the interference source through time-difference-of-arrival or signal strength mapping. The redundancy of multiple nodes also means that a single hardware failure does not create a monitoring gap.
In the Middle East, where ambient temperatures can exceed 45 degrees Celsius for extended periods, deploying traditional benchtop instruments in un-air-conditioned equipment shelters has been challenging. USB spectrum analyzers with wide operating temperature ranges, typically -40 to +65 degrees Celsius, can operate in these conditions without active cooling. Dongguan Chenyi Electronics has supplied USB monitoring solutions to several telecommunications operators in the Gulf region for remote base station spectrum monitoring, and the instruments have maintained calibration within specification through multiple summer seasons.
Another deployment scenario comes from a manufacturing company in Vietnam that needed to add RF testing to three production lines simultaneously but could not justify the cost of three benchtop analyzers. Chenyi worked with the customer to deploy three USB real-time spectrum analyzers connected to ruggedized laptops, each running automated test scripts that measured occupied bandwidth and spurious emissions for 2.4 GHz IoT modules at a rate of roughly 30 units per hour per line. The total system cost was comparable to a single mid-range benchtop analyzer, and the USB units have accumulated over 5,000 operating hours with zero hardware failures.
8. Limitations and When to Choose Benchtop
USB spectrum analyzers are not the right tool for every measurement. The benchtop instrument remains the correct choice when phase noise below roughly -110 dBc/Hz at 10 kHz offset is required, when absolute amplitude accuracy of 0.5 dB or better is critical, or when the measurement must be performed without a computer connected to the instrument. Benchtop analyzers also provide larger displays, dedicated front-panel controls that experienced engineers prefer for certain adjustments, and typically wider real-time bandwidth at the high end of the product range.
The decision framework we use at Dongguan Chenyi Electronics is straightforward. If the measurement requires benchtop-level phase noise or amplitude accuracy, buy a benchtop analyzer. For everything else, evaluate whether a USB analyzer meets the spec. In roughly four out of five customer conversations, the USB analyzer satisfies the measurement requirement at a significantly lower cost, with the added benefit of portability and easier automation.
9. Frequently Asked Questions
9.1 Does a USB spectrum analyzer require a powerful computer?
A modern laptop with a quad-core processor, 8 GB of RAM, and a USB 3.0 port is sufficient for most USB spectrum analyzer applications. Real-time spectrum display with persistence and spectrogram at the full FFT rate does benefit from a discrete GPU for smooth rendering, but the analyzer itself performs the FFT computation on its internal FPGA, so the host computer is primarily handling display and user interface tasks. For remote monitoring applications, a low-power single-board computer with a quad-core ARM processor can stream FFT data to a central server without any local display processing.
9.2 Can I use a USB analyzer with a tablet or phone?
Some USB spectrum analyzers support Android and iOS through companion applications that provide basic spectrum display and marker functions. However, the full measurement capability, including real-time persistence, spectrogram, and demodulation, typically requires a Windows or Linux host running the vendor's full application software or SDK. For field use, a Windows tablet with a USB port provides a good compromise between portability and full functionality.
9.3 How does calibration work for USB analyzers?
USB spectrum analyzers are calibrated at the factory and include internal calibration routines that run at power-up to compensate for temperature drift. Annual recalibration is recommended for instruments used in compliance testing, and the process is the same as for benchtop analyzers: the instrument is sent to a calibration lab or the manufacturer, where its amplitude and frequency accuracy are verified against traceable standards. Because USB analyzers have no embedded computer, calibration involves only the RF hardware, which can be quicker than calibrating a full benchtop system.
9.4 Are USB analyzers suitable for regulatory compliance testing?
USB analyzers with appropriate specifications can be used for pre-compliance testing, which is the internal engineering work done before formal certification. For formal compliance testing submitted to a regulatory body or notified body, the test lab typically uses benchtop instruments with current calibration certificates and documented measurement uncertainty budgets. Some USB analyzers from major manufacturers do meet the specifications required for formal compliance testing, but the end user should verify acceptance with their specific test house and regulatory authority.
Recently Posted
-
Key Performance Benefits of SM200B 160 MHz Instantaneous Bandwidth
September 9, 2026Key Performance Benefits of SM200B 160 MHz Instantaneous BandwidthTitle:Why 160 MHz Instantaneous Bandwidth Matters for SM200B Mon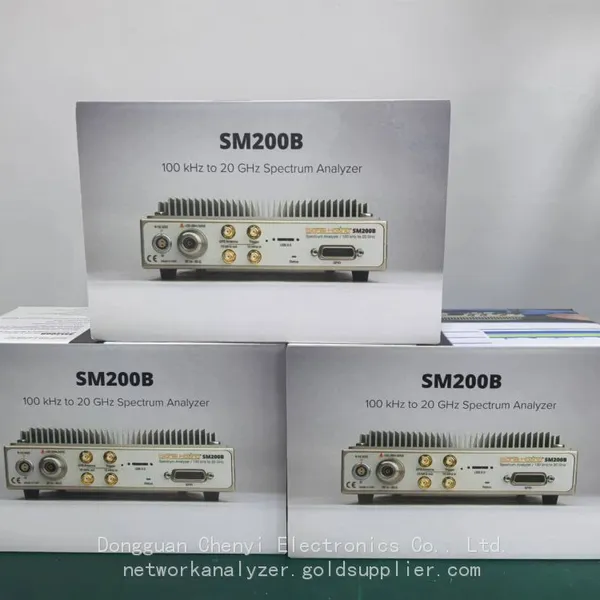 Read More
 -
Product Overview — What Is SM200B Real-Time Spectrum Analyzer and Monitoring Receiver
September 9, 2026Product Overview — What Is SM200B Real-Time Spectrum Analyzer and Monitoring ReceiverTitle:SM200B Real-Time Spectrum Analyzer &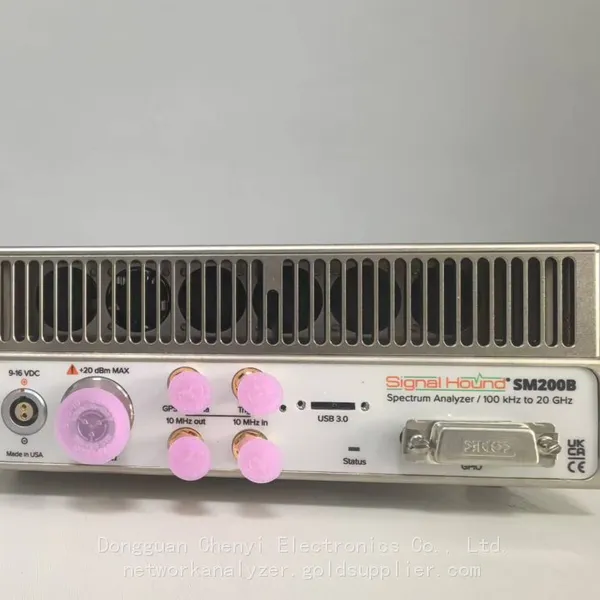 Read More
 -
Dongguan Chenyi Electronics: Your Professional RF Test and Measurement Instrument Supplier in Donggu
September 3, 20261. A Supplier That Understands What You Are Actually MeasuringBuying test instruments from a supplier that only moves boxes is a d Read More
 -
RF Test Instrument Calibration Intervals and Methods: Best Practices for Ensuring Measurement Accura
September 3, 20261. The 3 dB Error That Nearly Cost a CertificationA compliance engineer preparing a product for regulatory certification noticed t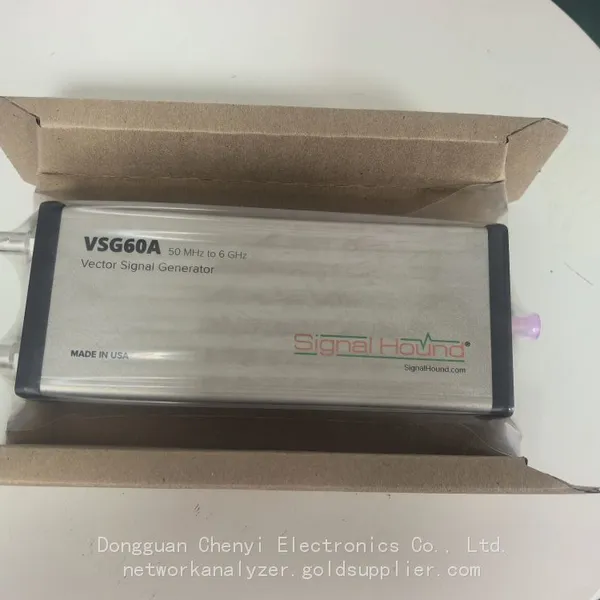 Read More

Contact Us
Recommended Products
-
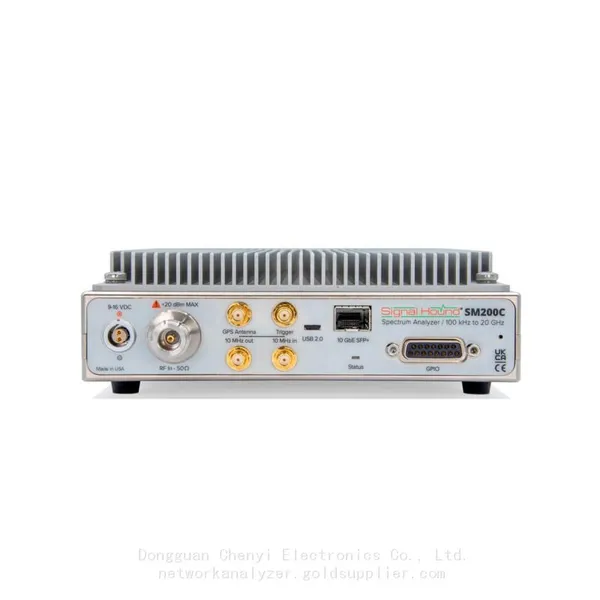
 Signal Hound SM200C 100 KHz to 20 GHz Real-time Spectrum Analyzer With 10GbE Monitoring ReceiversNegotiableMOQ: 1 Unit
 -
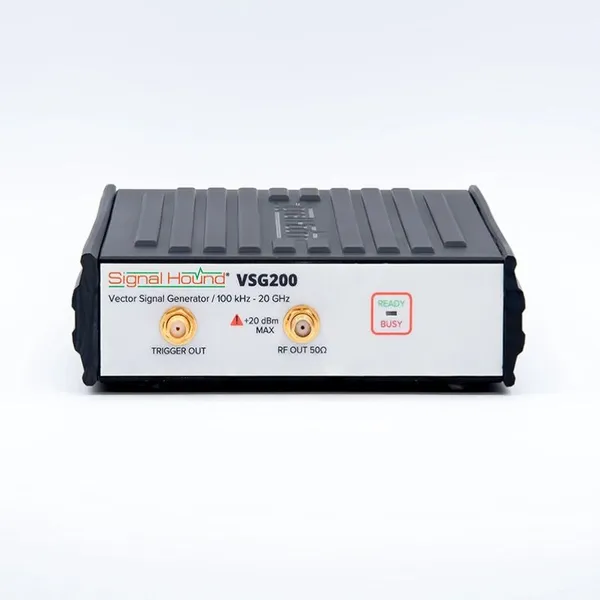
Signal Hound VSG200 Vector Signal Generator 100 KHz to 20 GHzNegotiableMOQ: 1 Unit
-
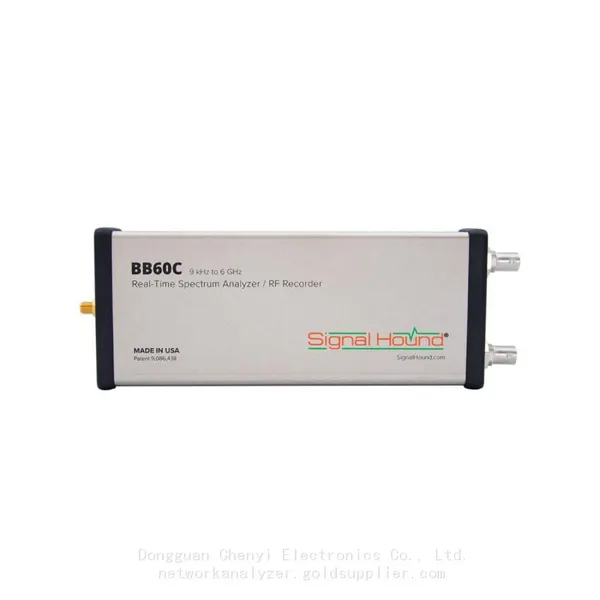
Signal Hound BB60C 9 KHz to 6 GHz Real-time Spectrum AnalyzerNegotiableMOQ: 1 Unit
-
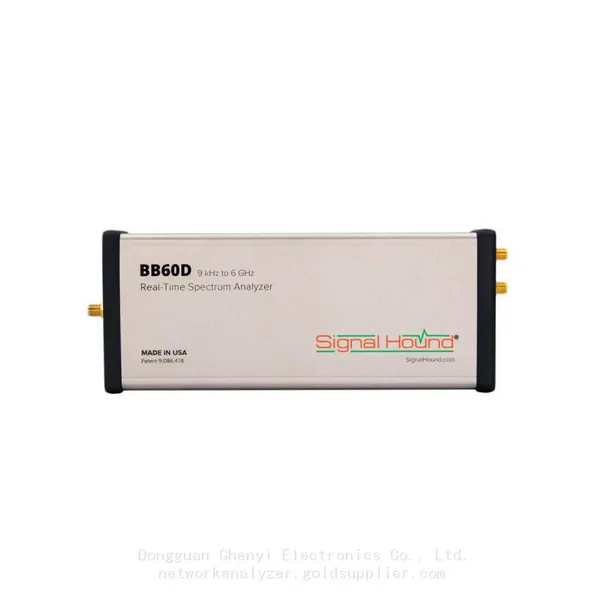
Signal Hound BB60D 9 KHz to 6 GHz Real-time Spectrum AnalyzerNegotiableMOQ: 1 Unit
-
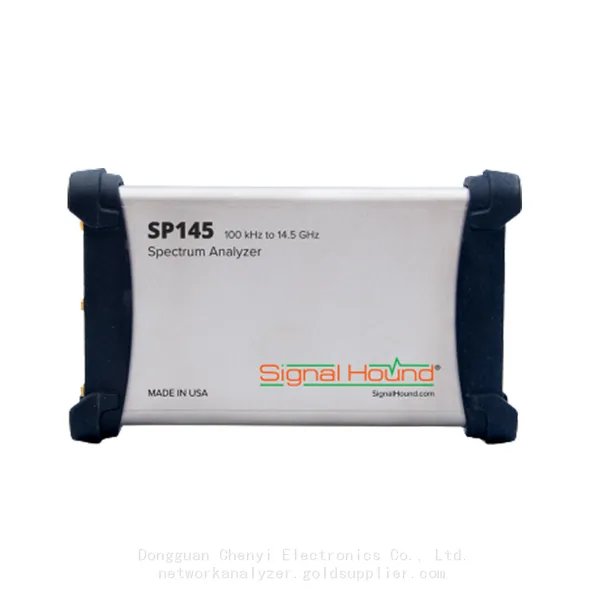
Signal Hound SP145 100 KHz to 14.5 GHz Real-time Spectrum Analyzer Monitoring ReceiversNegotiableMOQ: 1 Unit
-
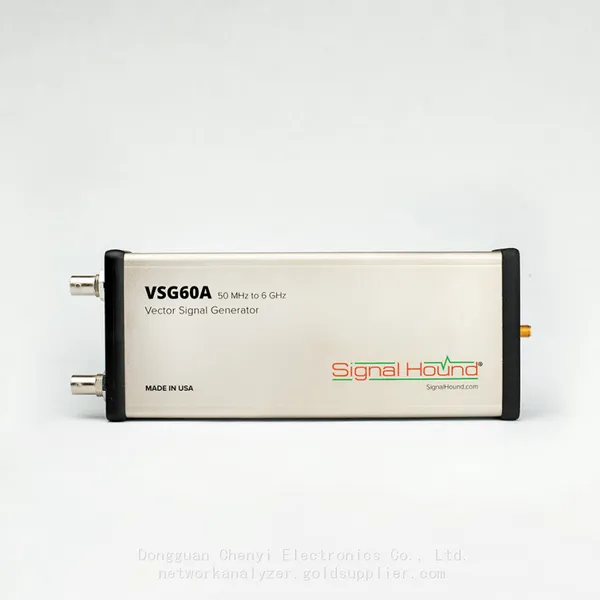
Signal Hound VSG60A 50 MHz to 6 GHz GHz Vector Signal GeneratorNegotiableMOQ: 1 Unit
-
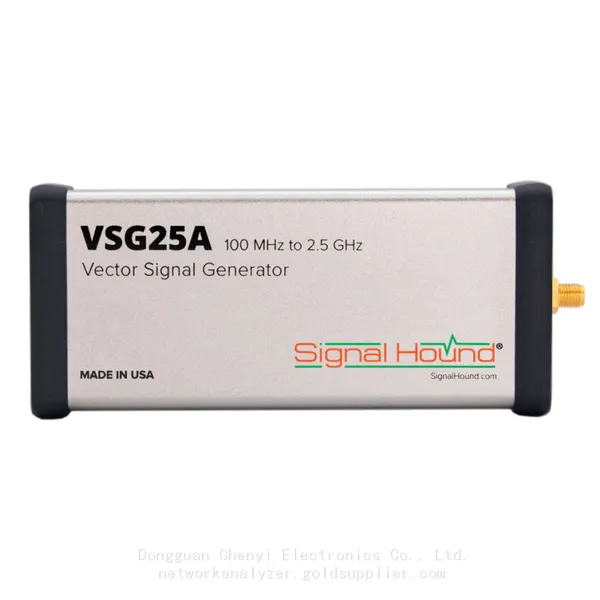
Signal Hound VSG25A 100 MHz to 2.5 GHz Vector Signal GeneratorNegotiableMOQ: 1 Unit
-
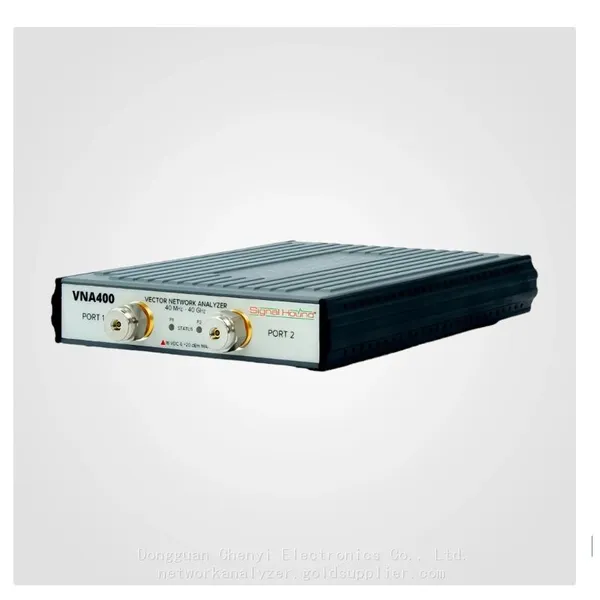
Signal Hound VNA400 40 MHz to 40 GHz 2-port Vector Network AnalyzerNegotiableMOQ: 1 Unit
-
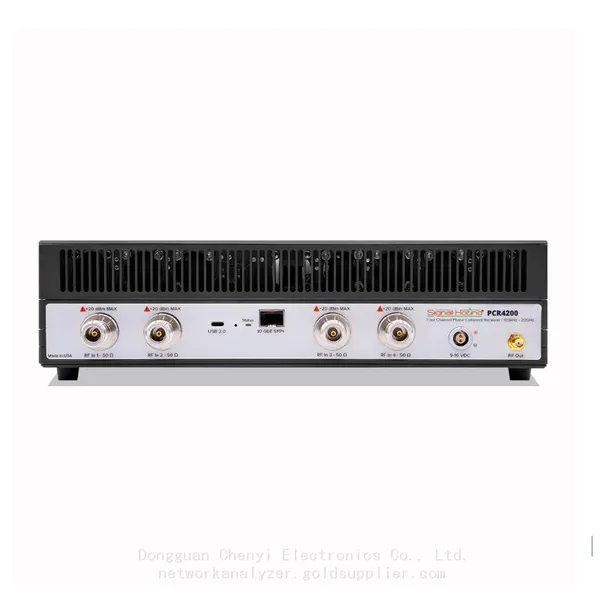
Signal Hound PCR4200 100 KHz to 20 GHz Four-Channel Phase Coherent ReceiverNegotiableMOQ: 1 Unit
-
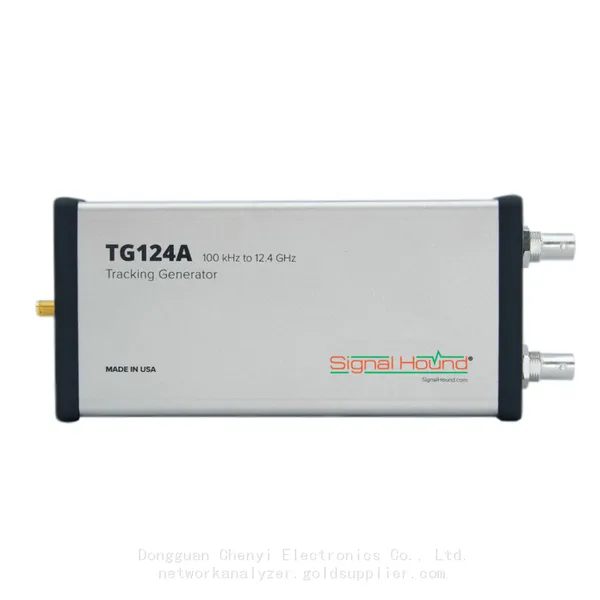
Signal Hound TG124A 100 KHz to 12.4 GHz Tracking GeneratorNegotiableMOQ: 1 Unit
-
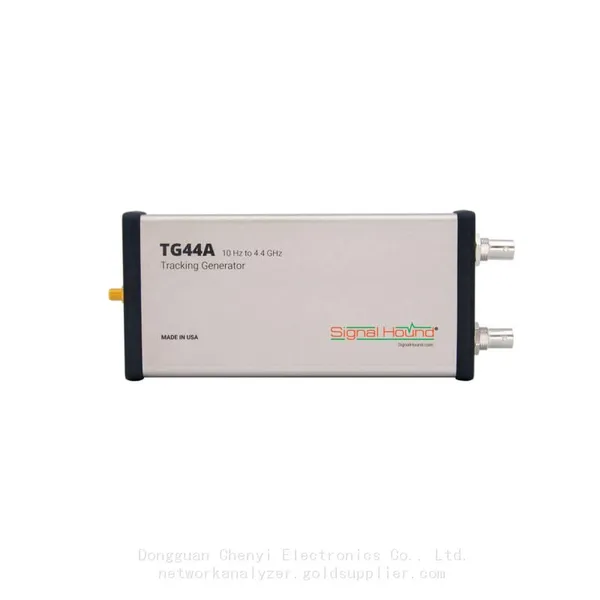
Signal Hound TG44A 10 Hz to 4.4 GHz t Tracking GeneratorNegotiableMOQ: 1 Unit
-
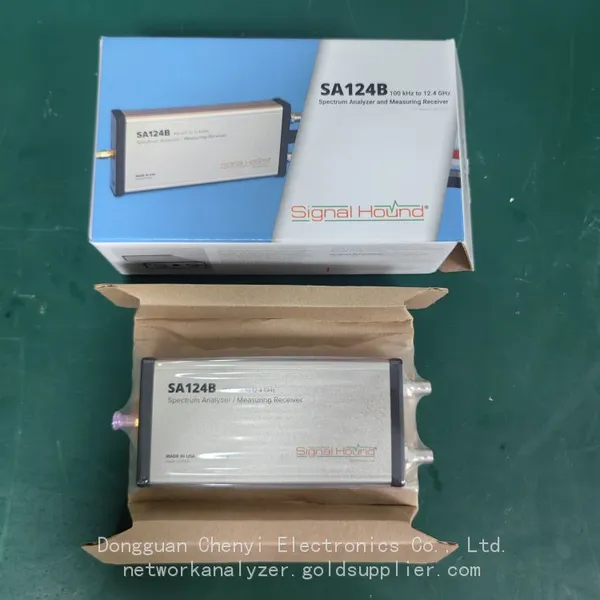
Signal Hound SA124B 100 KHz to 12.4 GHz Spectrum AnalyzerNegotiableMOQ: 1 Unit
-
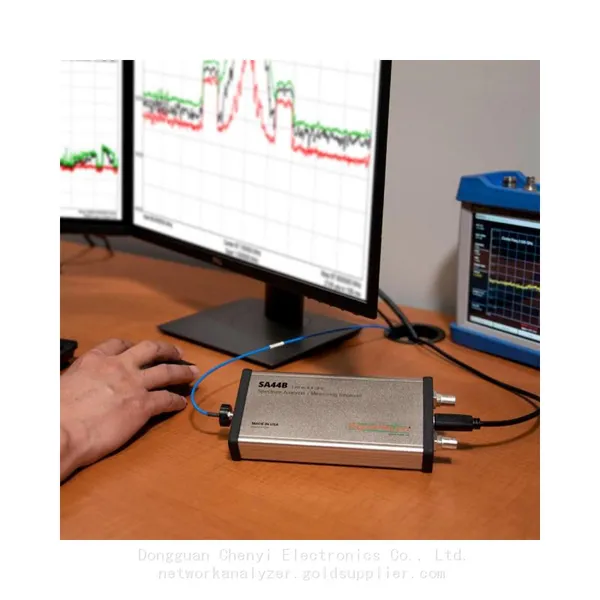
Signal Hound SA44B 1 Hz to 4.4 GHz Spectrum AnalyzerNegotiableMOQ: 1 Unit
-
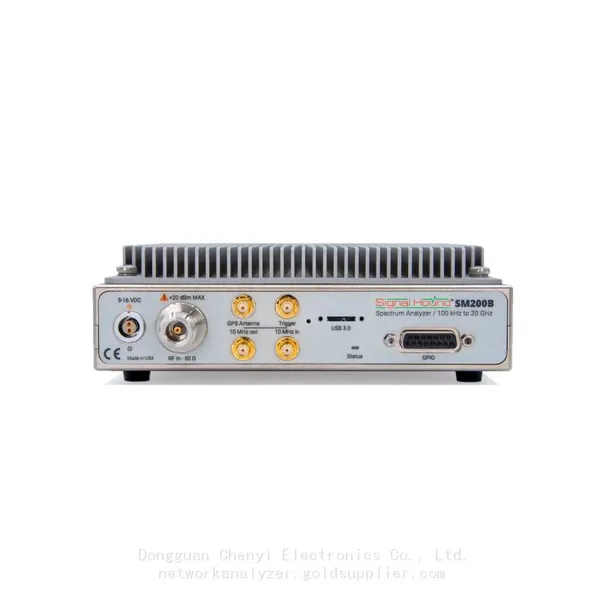
SM200B Real‑time Spectrum Analyzer,USB3.0 RTSA,100kHz-20GHz,calibrated I/Q Capture for 5G Test & Interference HuntingNegotiableMOQ: 1 Unit
-
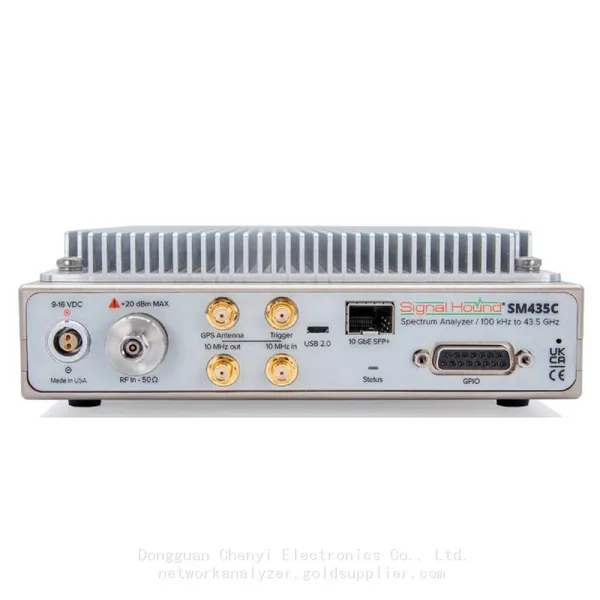
Signal Hound SM435C 100 KHz to 43.5GHz Real-time Spectrum Analyzer With 10GbE Monitoring ReceiversNegotiableMOQ: 1 Unit
-
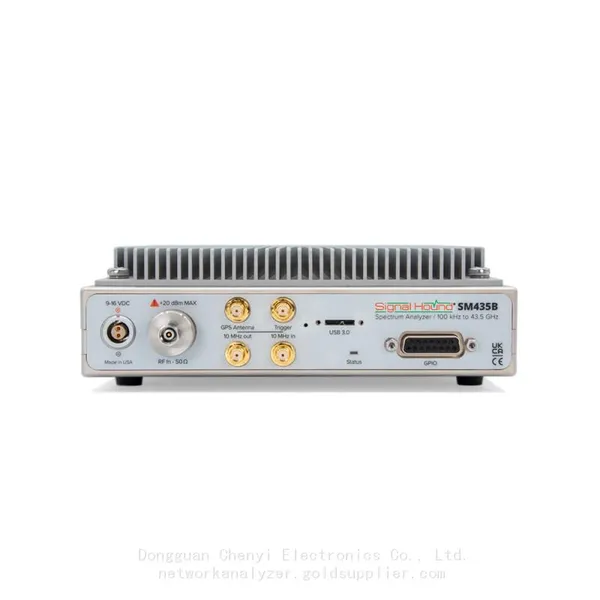
Signal Hound SM435B 100 KHz to 43.5GHz Real-time Spectrum Analyzer Monitoring ReceiversNegotiableMOQ: 1 Unit
-
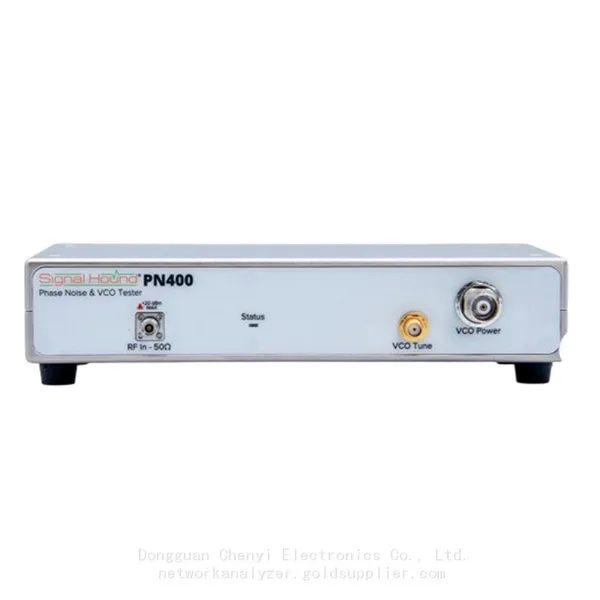
Signal Hound PN400 Phase Noise and VCO Test System 100 KHz to 43.5 GHzNegotiableMOQ: 1 Unit
-
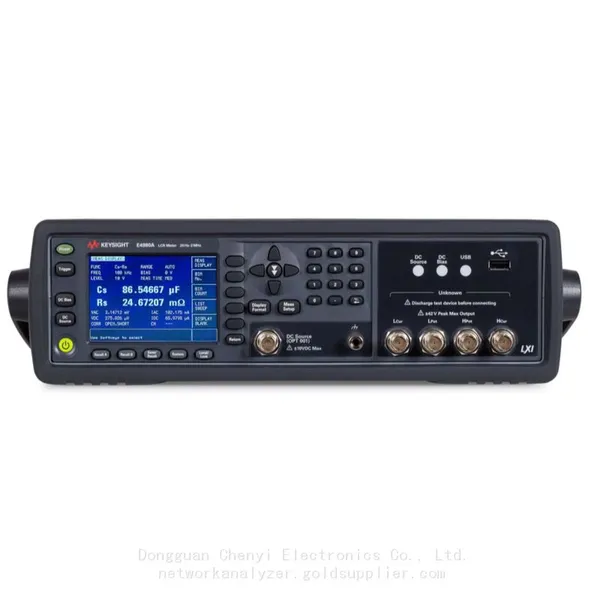
Keysight E4980A Precision LCR Meter 20 Hz to 2 MHzNegotiableMOQ: 1 Unit
-
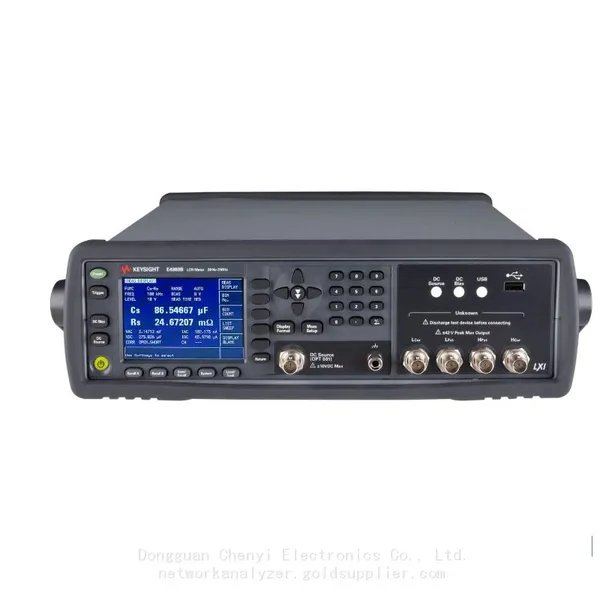
Keysight E4980B and E4980BL Precision LCR Meter 20 Hz to 2 MHzNegotiableMOQ: 1 Unit
-
Keysight U1733C Handheld LCR Meter 100Hz 120Hz 1kHz 10kHz 100kHzNegotiableMOQ: 1 Unit